Using dashboards
The Veracode Risk Manager (VRM) dashboard feature provides administrators an easy and intuitive way to create dashboards that are customized for your organization’s specific needs. This guide will help get you started on creating dashboards and highlight some of the key features that support your application security, risk reduction, or issue prioritization.
Create a dashboard
To create a dashboard:
-
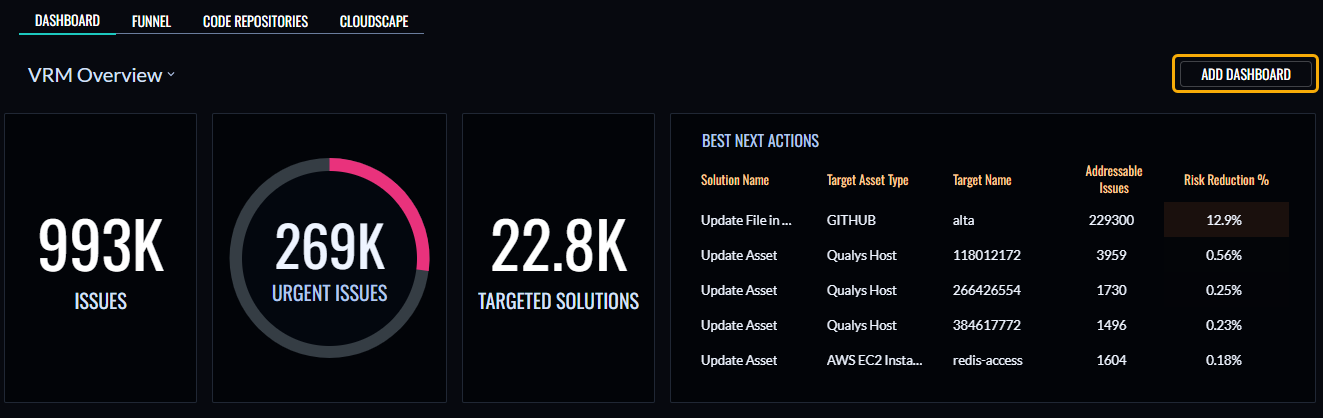
In VRM, on the Dashboard page, select Add Dashboard.
-
Edit the dashboard name and description.
-
Select Start Building Dashboard.
-
Select Add Card.
-
Configure the information you want to display, as described in the Metric Cards and Table Cards sections below.
-
Select Add Card.
-
Optionally, apply a filter, as described in the Card Filters section below.
-
Select Save.
There is no limit to the number of dashboards you can create in your account.
Sections
You can organize the cards in your dashboard into separate sections. A dashboard can have a total of four sections with up to six cards per section.
To rename a section, select the section name, enter the new name, and select Save.
To adjust the order of the sections, select the arrows new to a section name.
To adjust the order of cards within a section, drag the card to your preferred location.
Metric cards
Metric cards display a total count of assets, issues, applications, or solutions and take into account the filters you apply in the card. Filters are discussed below.
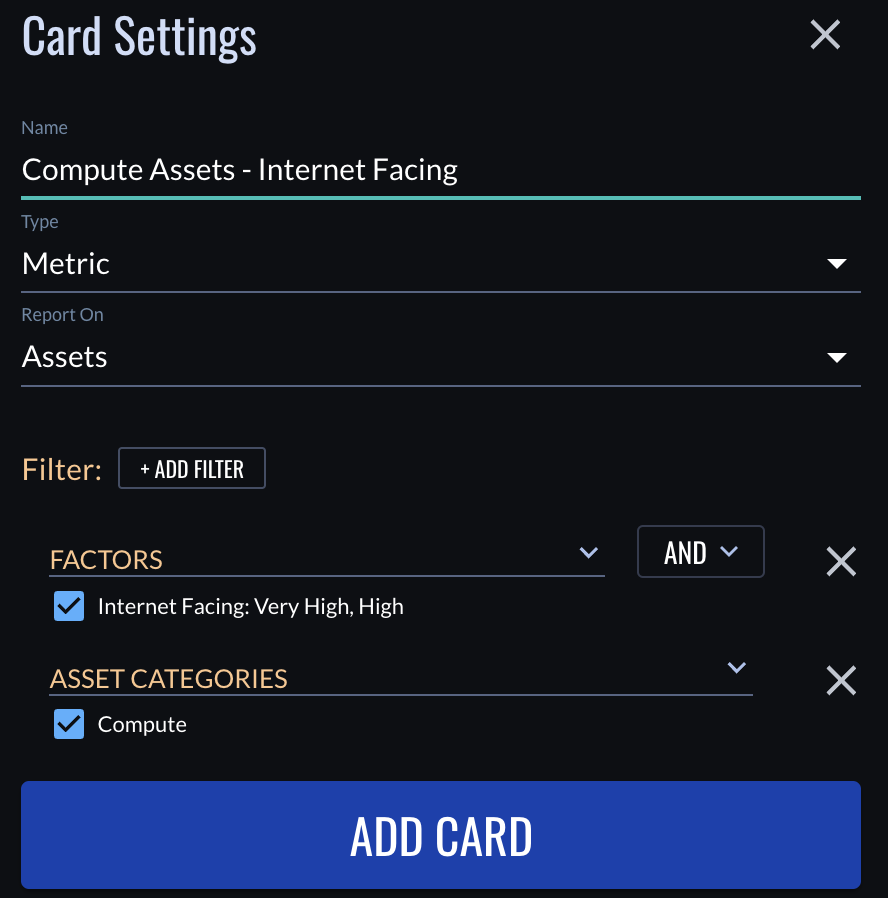
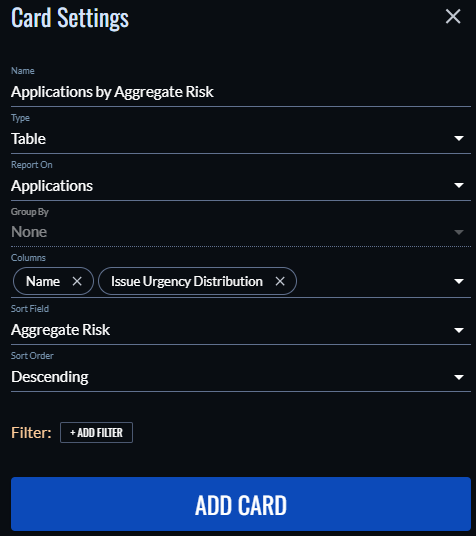
Table cards
Table cards display an ordered list of five rows of assets, issues, applications, or solutions. Table cards have the same filters available as metric cards, but also allow you to group your results. Select up to three columns to show in the table, and select a property of the data type on which to sort the data.
Group data in table cards
Use the Group By option in table cards to create ordered counts of your assets, issues, or solutions based on various properties of those data types. These counts help you understand the frequency of those properties across your security landscape.
For example, you might want to group issues by name to see a unified list of the most prevalent security problems.
You can apply the following groupings:
| Report On value | Group By value |
|---|---|
| Asset | Application, Category, Cloud Account, Factor, Tag, Type |
| Issue | Application Asset Tag, Asset Type, Cloud Account, Compliance Framework, Name, Source, Type |
| Solution | Application Asset Tag, Asset Type, Cloud Account, Compliance Framework, Name, Issue Source, Issue Type |
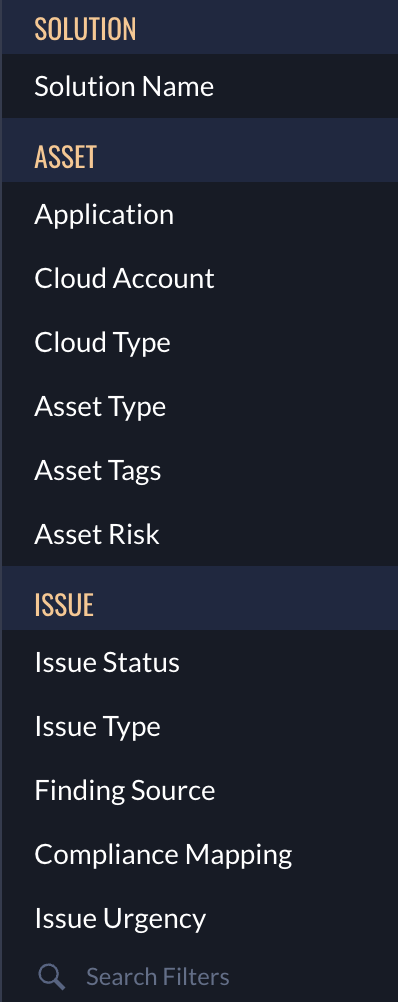
Filters
You can apply filters at the card level or at the dashboard level.
Card filters
Use filters on metric cards and table cards to produce dashboard cards that match the exact set of assets, issues, applications, or solutions that you need to meet your reporting goals. For example, you could create AWS Storage Assets - Internet Facing and AWS Compute Assets - Internet Facing cards.
The filters available for dashboard cards are the same filters available in the table views found elsewhere in the VRM platform. For example:
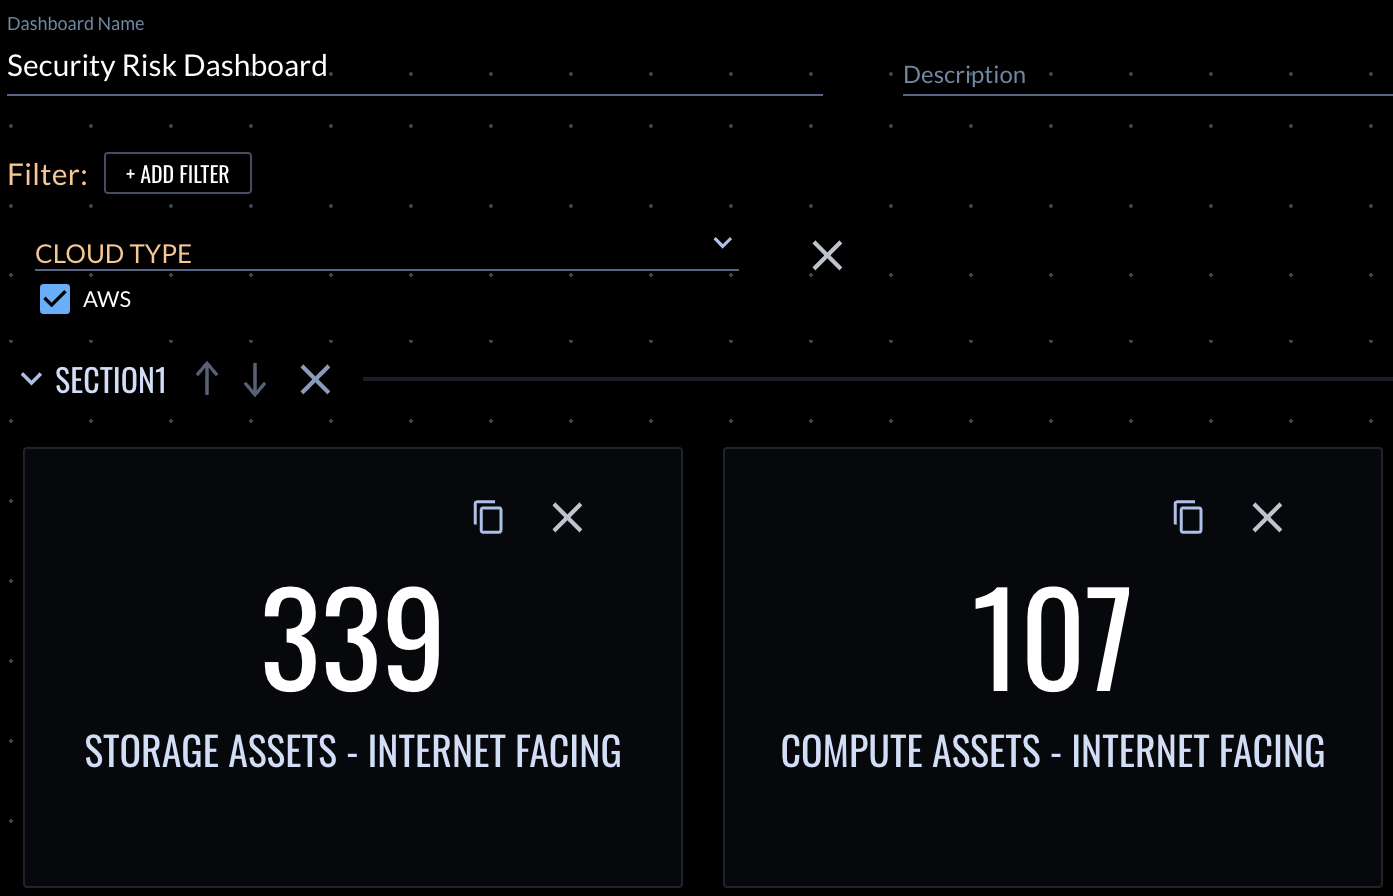
Dashboard filters
Setting filters at the dashboard level allows you to easily change a common parameter, such as Application, Cloud Account, Cloud Type, or Asset Tags, without having to edit every card in the dashboard. In the following example, you remove Cloud Type as a filter parameter from the individual cards and set it at the dashboard level. This makes it easy to change all the cards from AWS to Azure with a single update.
Card gallery
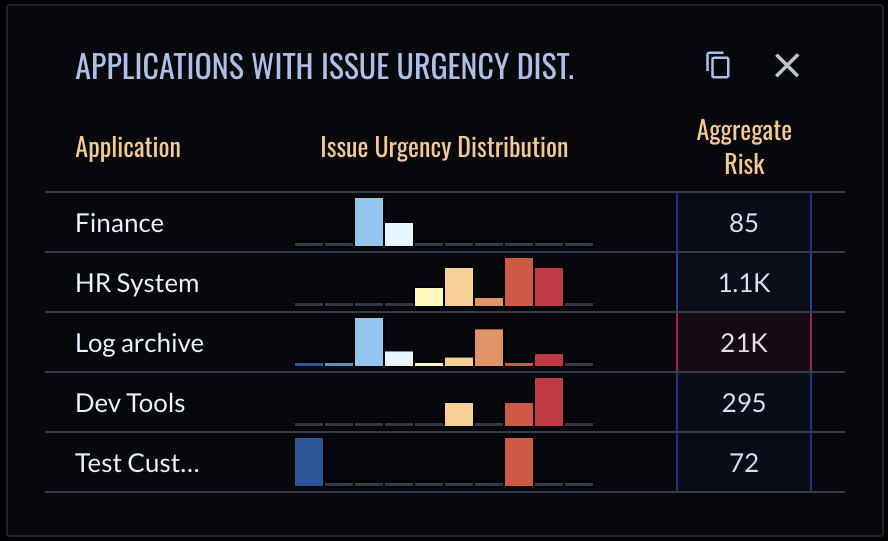
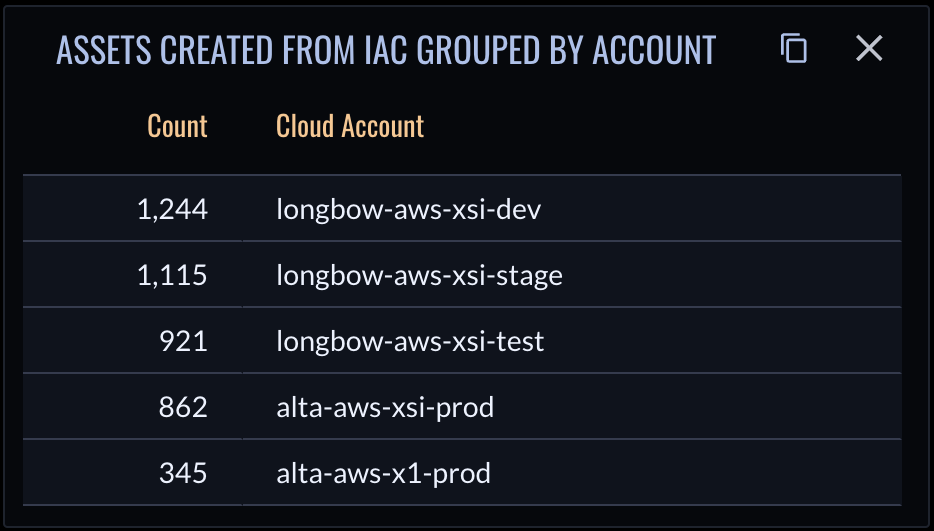
If you are looking for inspiration, see the following examples of the information you can include in cards in your custom dashboard:
- Applications with issue urgency distribution and aggregate risk level
- Number of assets created from IaC per account
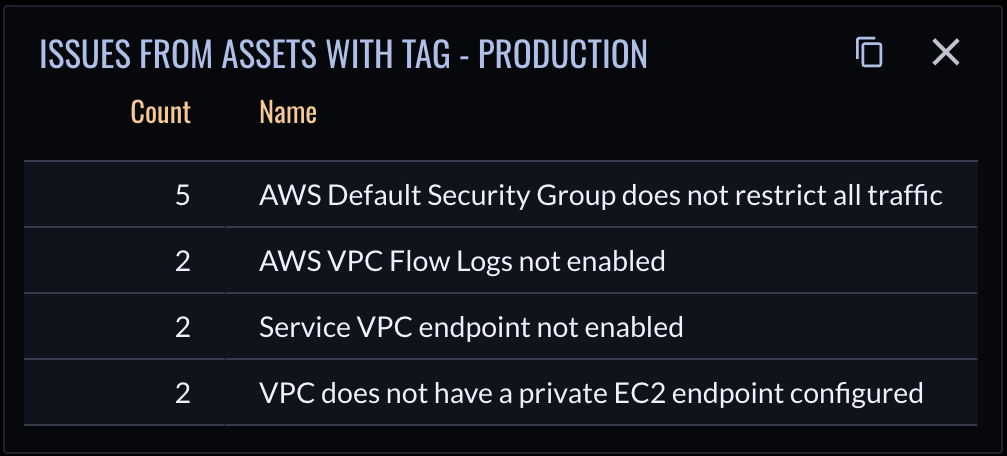
- Number of issues from assets that have the
Productiontag