Review flaws as a team
Use the Triage Flaws page in the Veracode Platform to review flaws collaboratively with your team.
If you are new to reviewing results from application security tests, we recommend scheduling a consultation with Veracode security experts. Also, before attempting to resolve findings, we recommend reviewing our guidance on developing a remediation plan.
After a scan completes, members of the application security and development teams can review the list of flaws and:
Search for a specific flaw
The Triage Flaws page in the Veracode Platform shows detailed information on each flaw detected during Veracode analyses of your application. You can search for flaws using one or several criteria, including negative criteria and wildcards.
Using one or more criteria
In some cases, you might want to review a specific subset of the flaws in your application:
- Flaws in a particular module or source file, or on a particular line number
- Flaws in a particular category, for example, cross-site scripting, or CWE
- Flaws you must fix to achieve policy compliance
- Flaws that are very likely to be exploited
- Very severe flaws
- New flaws
- Flaws involving a particular function
- Flaws with pending, approved, or rejected mitigations
- Flaws with a particular effort to fix
- Any combination of the above
You can search for any of these criteria using the Search field at the top of the list of flaws. To search for a particular item:
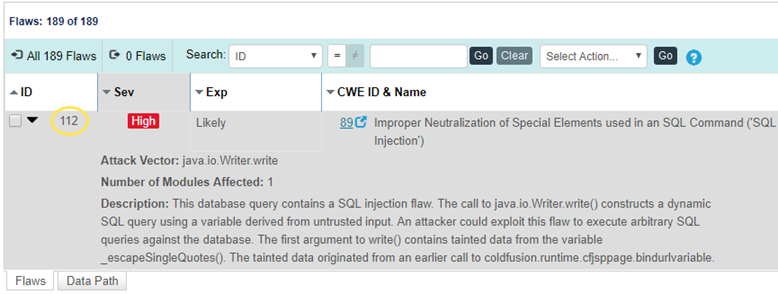
- Choose the column you want to search on from the Search dropdown list. The CWE ID & Name column maps the discovered flaw to the Common Weakness Enumeration (CWE) standard. If this flaw is stopping the application from passing policy compliance, the red shield icon indicates that a fix is required to meet the policy requirements.
- Enter your search criteria in the text box or select the appropriate criterion from the drop-down list.
- Select Go. The list of flaws filters by the search criterion entered, and the search criterion entered appears above the Triage Flaws toolbar.
The flaw count to the left of the list of filter criteria tells you how many flaws your search returned. The Count column shows the number of duplicate flaws that were imported from the scan results. A duplicate flaw is determined when the same type of flaw is discovered on the same line of code, in the same file, within any given module.
You can filter the list of flaws by one or more search criteria.
Searching by multiple criteria
If you want to use multiple search criteria, for example, to find all cross-site scripting flaws in a given module, search by the first criterion, then enter the second criterion. Both search criteria appear above the Search field in the list of search criteria.
If you add more than three search criteria, select More to view the full list of search criteria.
Using wildcards
Wildcard characters are automatically appended to text-based searches so that you receive the best set of results.
For example, if you search for categories flagged debug, the Veracode Platform returns all flaws in the Leftover Debug Code category.
Using negative criteria
You can specify a filter using a negative criterion, that is, is not equal to. You can use negative criteria to exclude a set of flaws from display, such as hiding all informational flaws (Severity=0).
To use a negative criterion:
- Choose the column by which you want to search from the Search dropdown list.
- Select = next to the list to toggle the button to the Not Equals (!=) state.
- Enter your search criterion in the text box, or select the appropriate criterion from the dropdown list.
- Select Go. The list of flaws filters by the search criterion entered, and the search criterion entered appears above the Triage Flaws toolbar.
Two or more negative criteria are joined by an AND. This means that you can exclude more than one item, such as multiple CWE IDs or severities, from the display at once by adding each one as a negative criterion.
Removing search criteria
You can select a search tag to remove that search criterion. The search list refilters to apply all search criteria except for the one that was removed.
If you have selected more than three search criteria, you can select More to show all criteria, then select on any item to remove it. Selecting Apply refilters the list.
Other ways to search
You can use the Fix First chart to quickly filter the list of flaws by combinations of severity of issue and ease of remediation. After you have established a filter, you can remove the search criteria as described above.
View data path information for flaws
You can view all paths through the code that lead to the sink, the exploitable point where a flaw is expressed, from a link on the Triage Flaws page.
To complete this task:
- From the application overview, select Triage Flaws.
- Select the link in the Data Paths column.
- The Data Path tab opens, where you can view each path that leads to the sink.
- To view details about a specific data path, select a path from the left panel. Details are displayed for each path, including the steps taken to exploit the flaw, filename or class, function name, and line number or relative location of the flaw by percentage.
- Fix each exploitable data path to remediate the flaw.
Use the source code view
The Source Code view allows you to load source code from your local system,or a network-accessible directory, into Triage Flaws so that you can view information about the flaw in the context of your original source.
The Veracode Platform does not have access to the source code for the application, and the source code is not uploaded to the Veracode Platform when you view it in the Source Code view.
Before you begin:
You must use an HTML5-supported browser.
To complete this task:
- From the Triage Flaws page, select Source Code Viewer at the top-right of the page, if it is not already selected.
- Select a flaw.
- If you have not previously loaded source code for this application, locate the source code on your hard disk when prompted. For reference, the Veracode Platform shows the fully qualified path of the source code that you used to build the application. The Veracode Platform loads the source code and scrolls the file to the line of code containing the flaw. If you selected the wrong source file, you can select Load Different File to change it.
- Hovering over the annotation on the left-hand column allows viewing a detailed description of the flaw and a remediation recommendation. You can also scroll through the code to view other flaws in the same source file, or use the Go to Line field to jump to a particular line.
View flaws found in non-debug code
The Veracode Platform allows you to view flaws found in code without debug symbols. Since source file and line number information is unavailable for these flaws, Veracode Provides other location information.
In the Flaws tab of the Triage Flaws page, the Source column contains the function prototype containing the flaw and the approximate location in the function body, by percentage, where the flaw occurs.
Selecting one of the flaws allows you to open a source file for reference. Veracode prompts you with the name of the class path containing the flaw.
Share a link to a flaw
You can provide a URL directly to the latest instance of a flaw to save your team the time of navigating through the Veracode Platform to find it.
You can share this URL with members of your team involved in triage and remediation to allow more convenient, direct access to the specific flaw.
To link directly to the latest instance of a flaw, create a URL using this template:
https://analysiscenter.veracode.com/auth/index.jsp#ReviewResultsFlaw:{account_ID}:{application_ID}:{sandbox_ID}:{flaw_ID}
Before you begin:
To provide the accurate URL, you must know the account ID, application ID, sandbox ID, and flaw ID.
To complete this task:
-
To find the account ID, open the application overview page and, from the URL, copy the ID number that immediately follows
https://analysiscenter.veracode.com/auth/index.jsp#HomeAppProfile: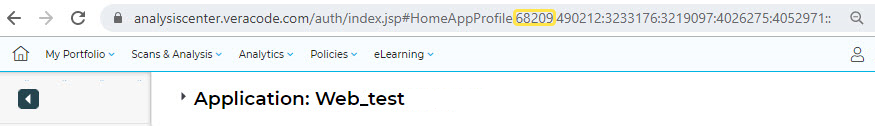
-
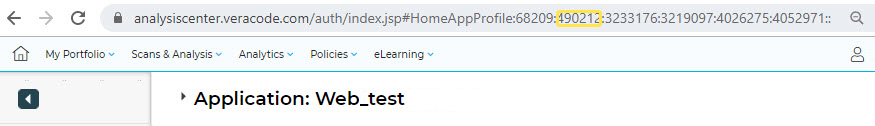
To find the application ID, open the application overview page and, from the URL, copy the ID number that follows the account ID.
-
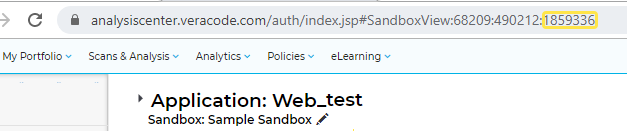
To find the sandbox ID, open a specific sandbox for the application and copy the ID number at the end of the URL. If the finding is from a policy scan, the sandbox ID is 0.
-
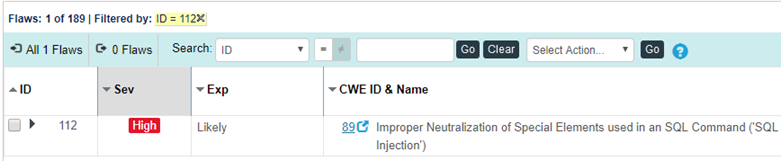
To find the flaw ID, open the Triage Flaws page and copy the ID of the flaw found in your scan.
-
After collecting the necessary IDs, insert them into the URL template for linking to the latest instance of a flaw:
https://analysiscenter.veracode.com/auth/index.jsp#ReviewResultsFlaw:{account_ID}:{application_ID}:{sandbox_ID}{flaw_ID}:This URL opens the Triage Flaws page for the specified sandbox, filtered by flaw ID to show the most recent instance of the flaw being found in a scan.